|
The Opportunity Index measures access to opportunity by combining 16 indicators into five categories of opportunity:
|
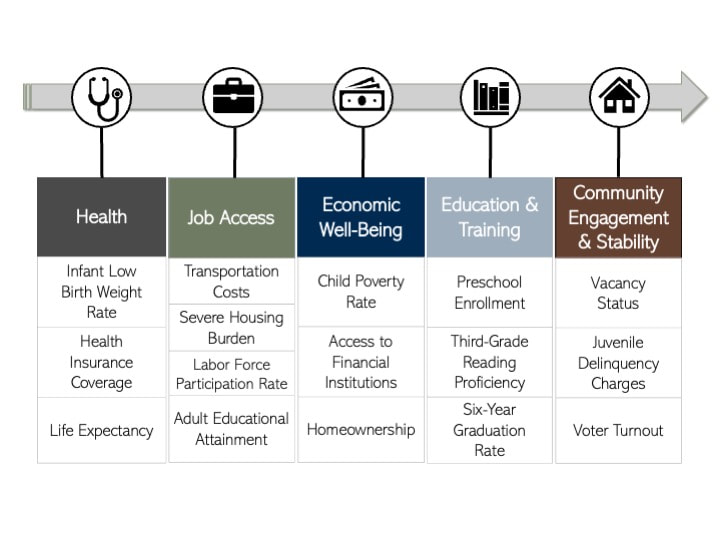
The chart shows the indicators that make up each category.
|
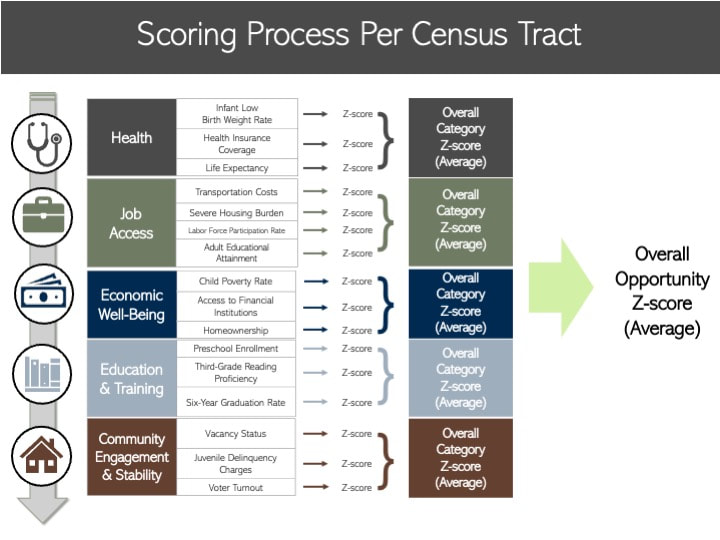
The chart shows how the z-scores for each indicator are averaged into the category z-scores, which are averaged into an overall opportunity score for each census tract.
To give a sense of each census tract's access to opportunity, the category scores and overall scores are divided into four ranking groups using a statistical process called "natural breaks." The ranking groups are: very high access to opportunity, high access to opportunity, low access to opportunity, and very low access to opportunity.
The Opportunity Index map displays those rankings for each category as well as overall opportunity. Dark blue is very high access to opportunity, blue is high opportunity, light red is low opportunity, and dark red is very low opportunity. Lower rankings indicate room for improvement relative to the rest of the county and are not necessarily a sign of poor outcomes. |
The Opportunity Index uses a standardized scoring process, which means the datapoint or estimate for each indicator at the census tract level is compared to the county-wide average for that indicator and then converted to a z-score.
A positive z-score means outcomes in that census tract are above the county-wide average, and a negative z-score means outcomes in that census tract are below the county-wide average. Z-scores allow for better apples-to-apples comparisons between different types of data. Category z-scores are the average of the indicator z-scores, and the overall opportunity z-score is the average of the category z-scores. 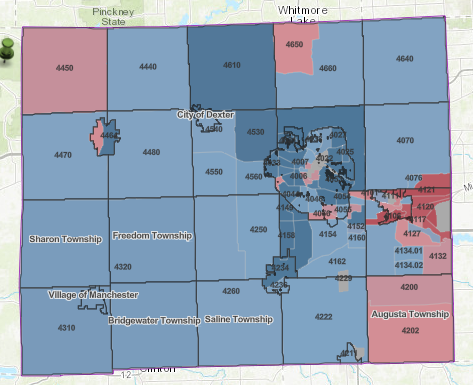
Dark blue means high access to opportunity, light blue is high opportunity, light red is low opportunity, and dark red is very low access to opportunity.
|
See the data dictionary or code book for a more detailed explanation of the methodology and the data source for each indicator.