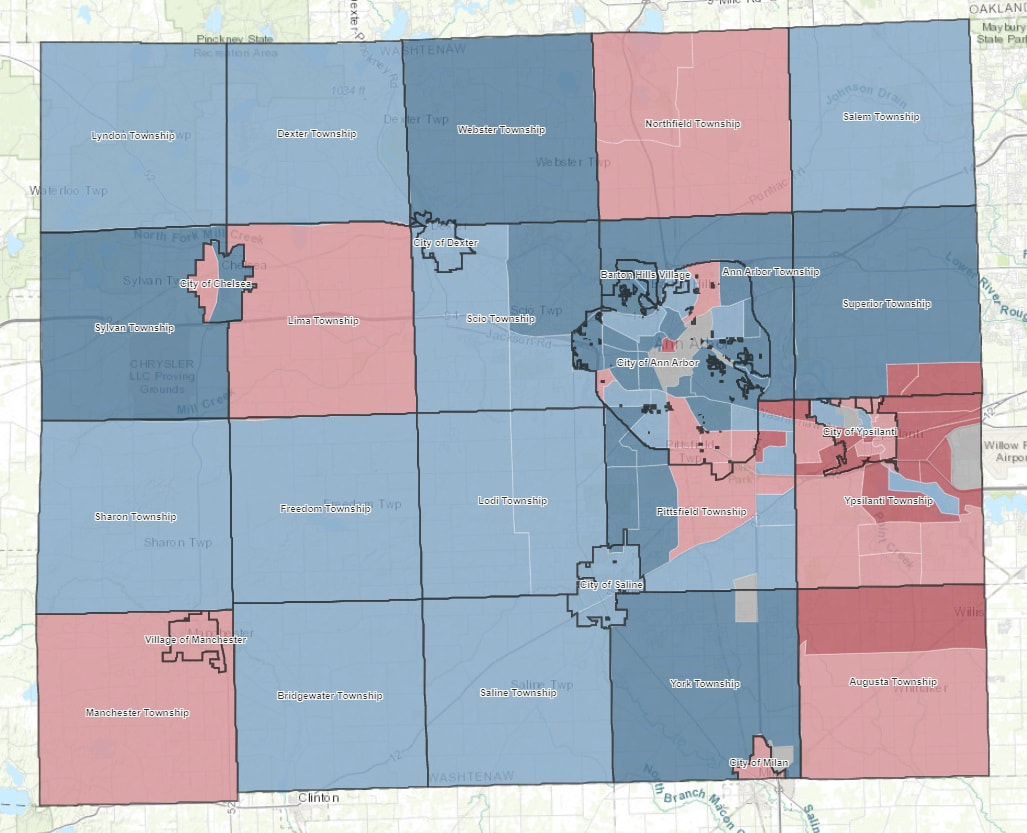
The map shows overall education and training scores.
Success in school allows students to pursue higher education and higher-paying jobs. However, there are many factors that impact a student's ability to succeed, like school funding and access to early education. Health, economic wellbeing, and community stability can also affect a student's success.
School funding is determined by where students go to school. This, along with school choice policies and the expansion of charter schools, means schools are competing for students. Schools that "lose" students are often in neighborhoods where housing segregation has consolidated lower-income people of color. The result is that already under-resourced schools face budget cuts due to declining enrollment. This further limits academic offerings and other student supports that help attract families. This cycle is continuous and has created large funding disparities between schools.
The Opportunity Index measures education using three measures. These are preschool enrollment, third-grade reading proficiency, and six-year high school graduation rates. It calculates these based on where students live, not where they attend school.
Pre-School Enrollment Rates
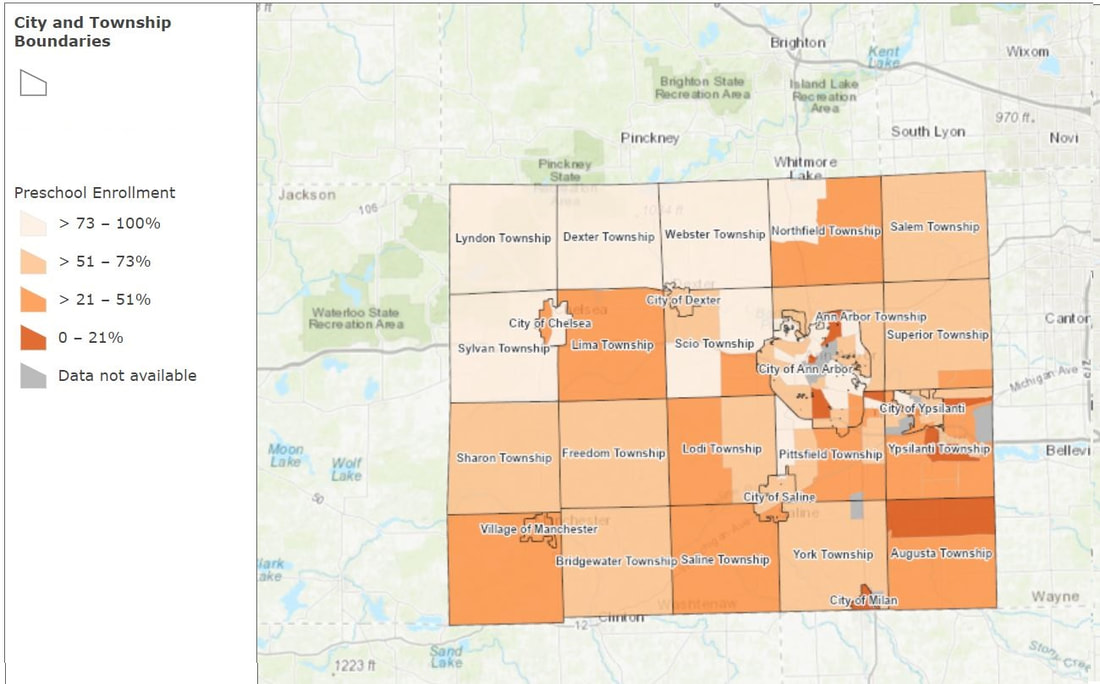
The map shows the percentage of 3 and 4 year olds enrolled in school (public or private), per census tract.
Access to high-quality preschool helps all children enter kindergarten ready to learn. Currently, preschool is not guaranteed to every child through public education in Michigan. This often means families have to pay for their child to attend preschool, which higher-income families can afford to do. Lower-income families must rely on programs funded by state and federal governments.
However, there is not enough funding for all students who qualify according to the Washtenaw Intermediate School District .
The result is disparities in education outcomes beginning early.
Children who are economically disadvantaged often enter elementary school behind their advantaged peers.
Ideally, at least 75% of 3 and 4-year-olds would be enrolled in preschool. (link?) Some communities in Washtenaw County meet this goal. Others have preschool enrollment rates of less than 25%.
Third Grad Reading Proficiency
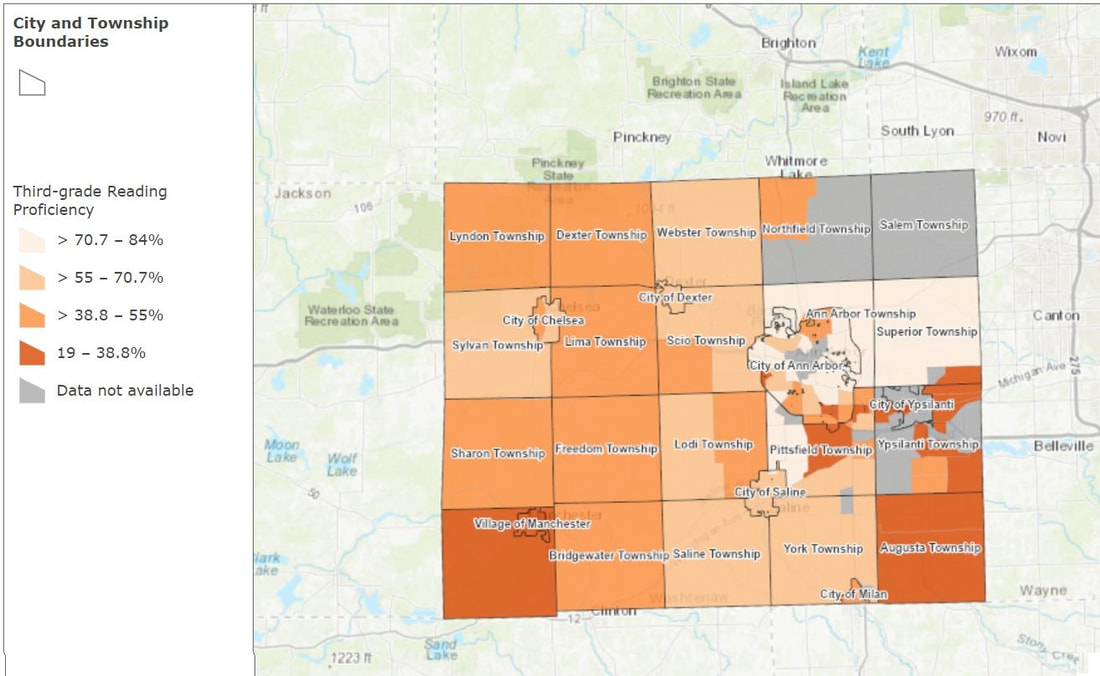
The map shows the percentage of third graders who tested as proficient or higher on the M-STEP English Language and Arts (ELA) assessment, per census tract.
Reading proficiency helps students keep up with their classwork and decreases the likelihood that they drop out. Third-grade reading proficiency varies based on where students live in Washtenaw County. This disparity can be caused by different levels of access to early education and learning that occurs in communities. This community learning can occur at libraries and other education-focused organizations.
Six-Year Graduation Rates
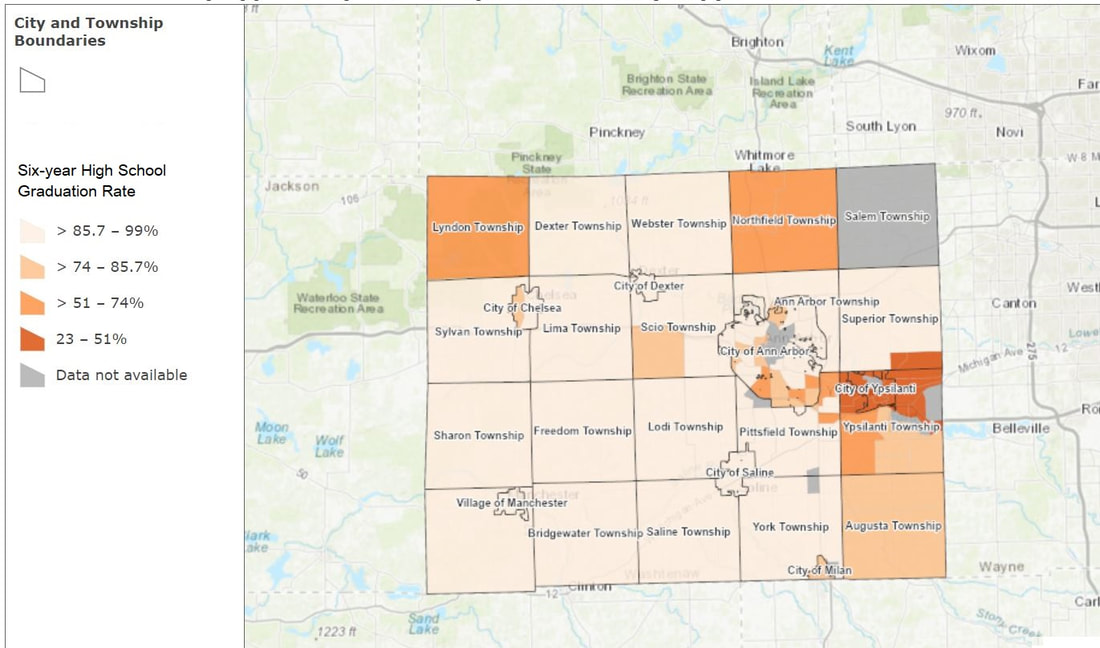
The map shows the six-year high school graduation rate per census tract.
A high school diploma is necessary to pursue higher education and well-paying jobs. While getting a diploma later in life is a great option for many, graduating on time impacts an individual's opportunity to succeed. The rate at which individuals accomplish this differs drastically in Washtenaw County. Less than 50% of students living in or around Ypsilanti receive their diploma within six years. In almost every other part of the county, this rate is above 85%.
The six-year graduation rate accounts for circumstances that may increase how long it takes students to complete the required number of credits. This gives a more accurate look than the 4-year graduation rate.
The six-year graduation rate accounts for circumstances that may increase how long it takes students to complete the required number of credits. This gives a more accurate look than the 4-year graduation rate.