COVID-19 has exacerbated existing racial disparities in Washtenaw County
The Opportunity Index can be an important tool to guide future decisions as we recover from COVID-19 and work towards a more equitable future.
This page will be updated as new data comes available.
The pandemic has substantially impacted the health and economic wellbeing of Washtenaw County residents; however, not all communities have been equally affected. The Washtenaw County Health Department has been tracking COVID-19 positive cases by race, age and gender, as well as geography.
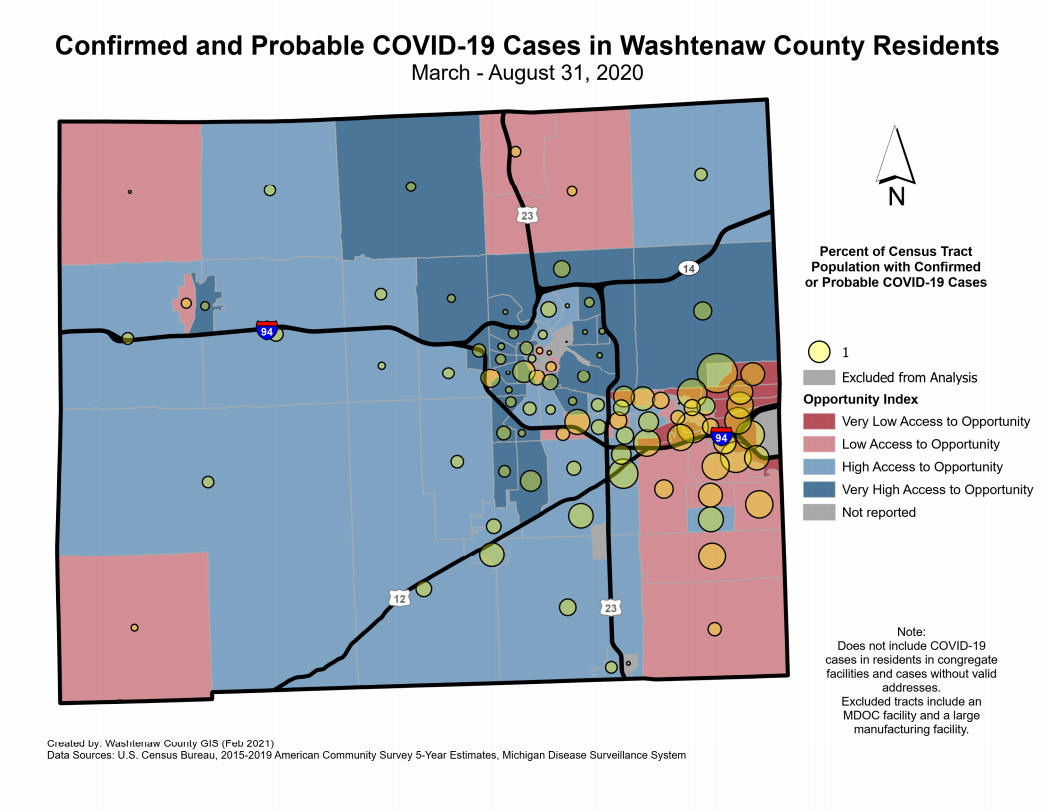
That data has been layered onto the Opportunity Index allowing us to examine which parts of our community have been disproportionately impacted by COVID-19. There is a strong overlap in COVID-19 positive cases in areas that have low access to opportunity score on the Index (See below). This has been caused by a number of factors, - a concentration of essential workers in lower-income communities, existing health disparities for residents of color, inequities in access to health care, and distrust of the broader healthcare system due to historic institutional racism, and more.
The map above layers COVID-19 positive cases onto the Opportunity Index map. Those yellow dots are scaled based on the rate of positive cases in each census tract. The larger the dot, the higher percentage of the population that tested positive for COVID. The majority of cases are in the urbanized area of Washtenaw County, with a larger number of cases on the east side, in neighborhoods the index shows as having less access to opportunity.
This is a prime example of how race and where you live impact both health outcomes and access to opportunity. Having access to structural privilege is not just about having the opportunity for a better future, but also being able to mitigate negative impacts of emergency situations, like a pandemic.
This is a prime example of how race and where you live impact both health outcomes and access to opportunity. Having access to structural privilege is not just about having the opportunity for a better future, but also being able to mitigate negative impacts of emergency situations, like a pandemic.
Spring (March - May) 2020

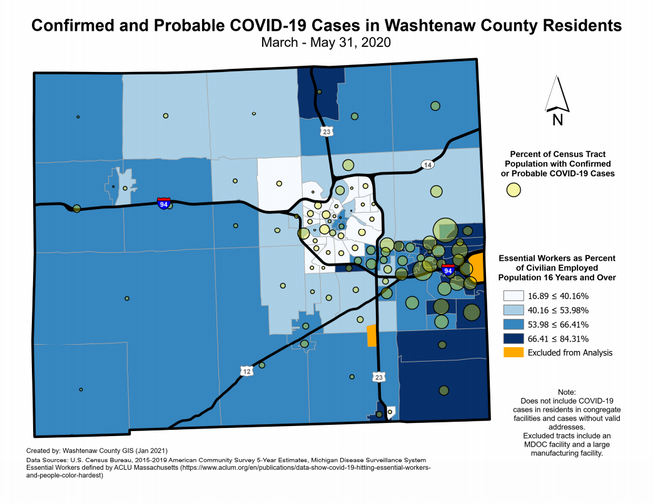
During the first few months of the pandemic, the State of Michigan was under shelter in place orders. Essential workers (e.g., nurses, grocery stores workers, bus drivers, mask producers) were among the few individuals who continued working in person and in regular contact with the public. This increased their exposure to contracting the virus. Essential workers are concentrated in majority Black and Brown communities in 48197 and 48198. The map to the right shows a strong overlap between positivity rates during Spring 2020 and these communities.
As noted, essential services workers are more likely to be people of color and to be exposed to COVID-19. They are also less likely to have access to full health benefits through their employment. Higher incidence paired with less access to health benefits, and higher levels of pre-existing conditions leads to increased mortality rates, which also exacerbates an existing disparity highlighted in the Opportunity Index: life expectancy.
As noted, essential services workers are more likely to be people of color and to be exposed to COVID-19. They are also less likely to have access to full health benefits through their employment. Higher incidence paired with less access to health benefits, and higher levels of pre-existing conditions leads to increased mortality rates, which also exacerbates an existing disparity highlighted in the Opportunity Index: life expectancy.
Summer (June - August) 2020
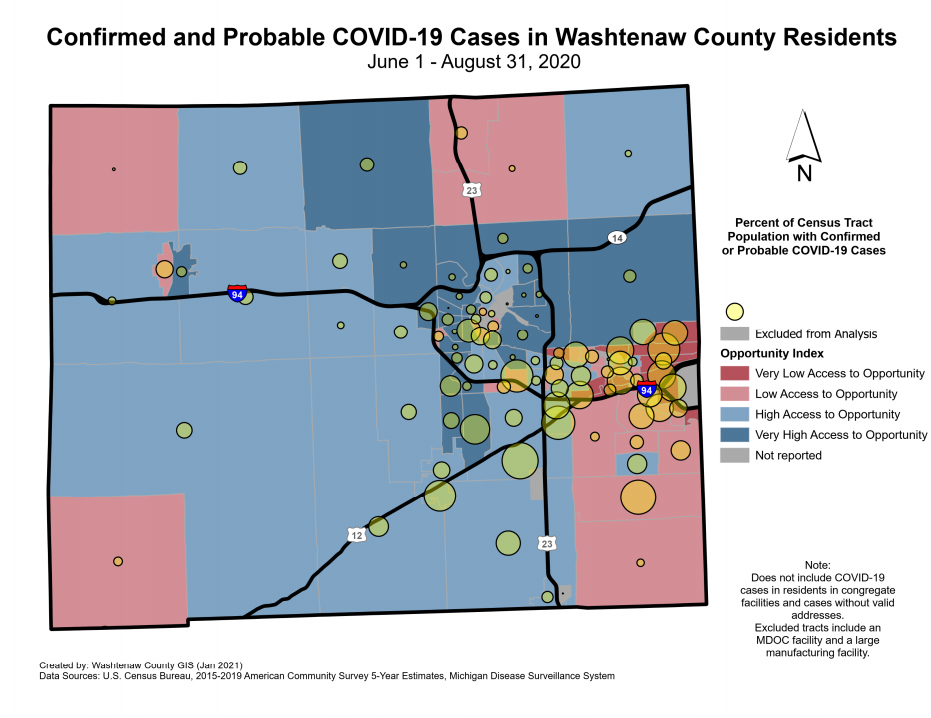
During the summer, the spread of COVID-19 in Washtenaw County continued to show high rates in areas with essential workers, but also expanded to include higher rates in more smaller communities.
This shift saw more spread in smaller communities linked to low compliance with recommended mitigation strategies (e.g., lack of mask-wearing, specific large social gatherings including school-year end celebrations and weddings). Access to care in rural areas and smaller communities may have also impacted the amount of time it took for individuals to be diagnosed, and could have increased spread.
This shift saw more spread in smaller communities linked to low compliance with recommended mitigation strategies (e.g., lack of mask-wearing, specific large social gatherings including school-year end celebrations and weddings). Access to care in rural areas and smaller communities may have also impacted the amount of time it took for individuals to be diagnosed, and could have increased spread.
Other Data Sources
- The Intersection of race and COVID impact among Ypsilanti Residents was explored this summer. Click here to read a white paper on findings.
- The Washtenaw County Health Department reports COVID-19 case data by race and zip code on this webpage.
- More data related to COVID-19 and opportunity will be posted to this list as they become available.
Notes on COVID+ cases mapped above:
See the data dictionary for a more detailed explanation of the methodology of the underlying Opportunity Index maps.
- Data shown above Includes the rate of confirmed and probable positive cases for adult populations by each census tract. The larger the circle, the greater the proportion of residents with a confirmed or probable positive case of COVID-19.
- Not shown are the COVID-19+ cases at congregate sites such as skilled nursing facilities, jails, homeless shelters and group homes. These were not included as they don’t reflect community spread, were often confined at the congregate site, and differ from the populations outside the facility.
- Data depicts positive and probable cases, as during the spring and summer, the practice for individuals with symptoms was to isolate in place, as there were a limited number of tests early in the pandemic.
See the data dictionary for a more detailed explanation of the methodology of the underlying Opportunity Index maps.
Proudly powered by Weebly

